Integrated Transit Fare Vision: FAQ & Background
Q: Why was a zone-based fare selected? What are alternatives?
A: A number of alternative fare integration models were studied, ranging form region-wide flat fares to pure “fare by distance”, per the diagram below.

Excerpt from Fare Integration study in the Greater Toronto and Hamilton Area (GTHA) comparing the various types of systems.
We looked at regions with high performing transit systems, nearly all of which had integrated fare systems, but which were split among zone-based fares (more common in Europe) and fare-by distance (more common in Asia).
Worldwide examples of different fare modes. |
||
|---|---|---|
| Zone-Based Fares | Zoned Based Fares and Fare by Distance Mix | Fare by Distance / Distance Bands |
|
|
|
We referred significantly to Metrolinx’s recent business case study evaluating fare integration opinions, which concluded that both zone-based fares and measure-distance fares offered large significant benefits over no fare integration at all.
We also referred to recent studies in Australia and Europe evaluating different fare structures and Vancouver’s recent evaluation of their own fare-based system based on user research.
Given that our primary goal is to create awareness of fare integration by creating a compelling map or tool, we felt that a zone-based fare vision map - such as those that many riders have seen in other part of the world - would create the most powerful visual, and it would offer a significant improvement over current fare structures for users. We believe the Fare Integration Study underway by MTC is the right venue to fully evaluate the pros and cons of any approach.
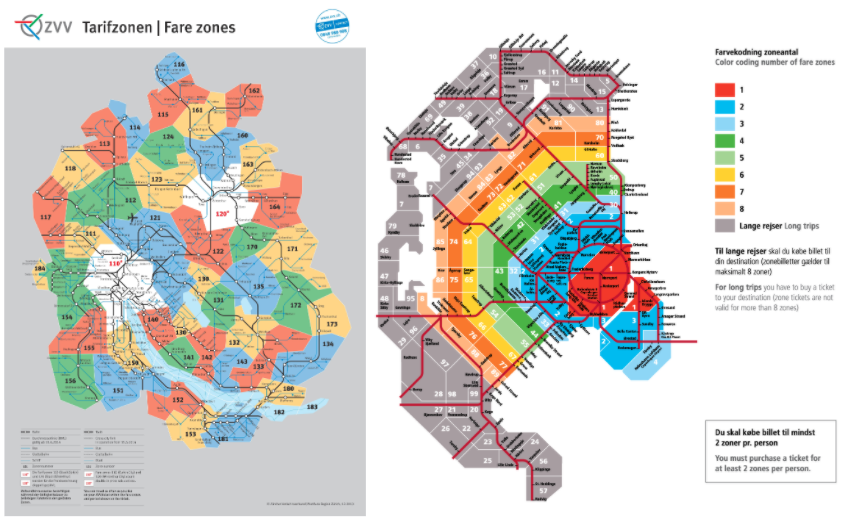
Examples of zone-based fare maps from Zurich (left) and Copenhagen (right)
Q: Why are only some transit lines shown on the map?
A: The Fare Integration Vision Map is done on a base transit map that represents selected, existing Bay Area transit lines only; the lines on the map base represent key connections of the Bay Area’s transit system that existed as of March 2020 (prior to COVID service changes). The lines shown on the base map correspond to what MTC has chosen to display on its Regional Transit Map as key regional corridors. Any lines not shown on the map are for clarity and readability reasons only, and do not suggest any suggestions to remove or eliminate service.
Q: Why doesn’t the map include Sacramento, Santa Cruz, or Tracy?
A: The Fare Integration Vision map only covers the nine-county Bay Area, to correspond to the current efforts to integrate transit in the nine-county region. However, the zone-based fare system could easily be extended beyond the nine-county region, should transit agencies in other counties want to extend the system - they would have to enter into an agreement with the Bay Area Network Manager administering the fare system.
Q: How was the pricing formula developed?
A: The formula for calculating fares is similar to the pricing formula BART uses. The following table shows the BART Fare structure in 2019.
BART Fare Structure (2019)Clipper fares; Blue magnetic stripe ticket fares are 50 cents more per trip. |
||
|---|---|---|
| Trip Length | Minimum Fare: Up to 6 miles | $2.00 |
| Between 6 and 14 miles | $2.05 + 15.0¢/mile | |
| Over 14 miles | $3.22 + 9.0¢/mile | |
| Surcharges | Transbay | $1.00 |
| Daly City | $1.15 | |
| San Mateo County | $1.44 | |
| Capital | $0.13 | |
| Premium fare applied to trips to/from SFO | $4.54 | |
| Oakland Airport Project Fare | $6.16 | |
The Integrated Fare Vision broadly adopts, but simplifies the BART structure. It starts with a base fare of $2.20, which is higher than BART’s base fare but lower than that of most bus operators. The first two zones you travel within - each zone being roughly 7 miles wide - are considered part of the “base fare” price, which ensures that riders starting or ending their trip near a zone boundary won’t be penalized. For trips that go beyond two zones, the Integrated Fare Vision takes the average cost of approximately 12 cents per mile, which works out to about $1.00 per additional 7-mile zone. This contrasts to BART which has different per-mile pricing formula for trips 6-14 miles (15 cents/mile), and over 14 miles (9 cents/mile).
Like BART’s and most bus agencies’ pricing structures, there is a surcharge for crossing a major body of water in a bridge or tunnel; in the zone-based fare system, the charge is a flat $1, so on the map these simply are shown as an additional zone. Oakland and SFO airports are also each their own zones, simulating a $1 surcharge - a significantly lower surcharge than the current BART surcharges, helping make transit more competitive with Uber/Lyft for airport trips, and making transit far more affordable for airport employees.
Q: What is fare capping and why have you proposed it instead of daily / monthly passes?
A: The practice of fare capping is a way of giving the benefits of high-volume discounts to more people, including low income people who may not be able to afford paying for a monthly pass all at once, or people who can’t predict if it makes sense to buy a pass at the beginning of a day, week or a month.
The Integrated Fare Vision establishes daily, weekly, and monthly fare caps available to all riders, so that anyone who reaches the cap in a given day, week, or month, will enjoy the rest of the transit rides they take during that time period for free.
This policy helps provide an added incentive for people to use transit for all types of trips - not just commute trips - as well as significant financial relief for transit dependent and low income people. Discount rates (50%) are the same on the daily, weekly, and monthly fare caps as on single ride products.
The proposed fare caps are as follows:
Full Fare Table: Single Ride, Daily, Weekly and Monthly Maximum FaresOnce you reach the daily, weekly, or monthly cap, you automatically will not be charged additional fares |
||||||||
|---|---|---|---|---|---|---|---|---|
| Single Ride | Daily Cap | Weekly Cap | Monthly Cap | |||||
| Adult | Discount | Adult | Discount | Adult | Discount | Adult | Discount | |
| 1-2 Zones | $2.20 | $1.10 | $5.50 | $2.75 | $19.80 | $9.90 | $79.20 | $39.60 |
| 3 Zones | $3.20 | $1.60 | $8.00 | $4.00 | $28.80 | $14.40 | $115.20 | $57.60 |
| 4 Zones | $4.20 | $2.10 | $10.50 | $5.25 | $37.80 | $18.90 | $151.20 | $75.60 |
| 5 Zones | $5.20 | $2.60 | $13.00 | $6.50 | $46.80 | $23.40 | $187.20 | $93.60 |
| 6 Zones | $6.20 | $3.10 | $15.50 | $7.75 | $55.80 | $27.90 | $223.20 | $111.60 |
| 7 Zones | $7.20 | $3.60 | $18.00 | $9.00 | $64.80 | $32.40 | $259.20 | $129.60 |
| 8 Zones | $8.20 | $4.10 | $20.50 | $10.25 | $73.80 | $36.90 | $295.20 | $147.60 |
| 9 Zones | $9.20 | $4.60 | $23.00 | $11.50 | $82.80 | $41.40 | $331.20 | $165.60 |
| 10 Zones | $10.20 | $5.10 | $25.50 | $12.75 | $91.80 | $45.90 | $367.20 | $183.60 |
| N Zones | $N | 50% off $N | 2.5x Single ride fare for N Zones | 50% off adult daily cap | 9x single ride fare for N zones | 50% off adult weekly cap | 36x single ride fare for N zones | 50% off adult monthly cap |
| *50% Discount fare applies to all Seniors (over 65), Youth (13-18), Students, Persons with Disabilities, Low-Income Households. Children 12 and under ride for free. | ||||||||
Q: How much would implementing the Integrated Fare Vision cost?
The Metropolitan Transportation Commission (MTC) estimated that integrated fares was one of the most cost-effective projects our region could invest in, attracting more people to transit and reducing costs for low income people. They estimated that a fare integration pricing system similar to the Integrated Fare Vision would likely be revenue neutral over the long term — in other words, any loss of revenue due to lower fares would be offset by increases in revenues from higher ridership. When combined with a 50% discount for low-income riders, MTC estimated the cost over 30 years to be $10 billion.
Seamless Bay Area did its own high level cost estimate of this specific Integrated Transit Fare Map, which also includes a 50% discount for low income adults as well as a consistent 50% discount for Youth, Seniors, Disabled, and Students. Using BART and National Transit Database data on ridership and revenue for all Bay Area transit operators from FY18-19 (pre-COVID era), we projected the impact to revenue if all actual trips taken in FY19 had been priced with Integrated Fare Vision prices instead of the current prices.
Using some assumptions about the distribution of Adult, Youth, Senior and RTC trips across the region about the number of trips taken by low income adults, we found that there would be marginal revenue loss (0-2%) to the regional fare pool. In other words, the region collected about $1 billion in fare revenue in FY18-19 with current fare pricing. If the region had taken the same set of trips, but those trips had been priced according to the Integrated Fare Vision, the region would have still collected ~$1 billion in fare revenue.
Furthermore, our analysis found that if we estimated that 30% of adult trips came from Low Income adults who had access to the 50% Low Income discount, then the region would need to find an additional $150 million annually to pay for the discount, or an operating loss of 15%, which could come from multiple sources beyond fare revenue.
Of course a true financial assessment of any fare policy is not as simple as a one for one pricing replacement. Over a year, residents of the Bay Area would change their behavior with respect to the introduction of any new transit pricing approach, which is why the Fare Integration and Coordination Study will use a pricing model that accounts for changes in behavior due to pricing to evaluate the Integrated Fare Vision and/or similar approaches.
This analysis was designed merely to provide a rough order of magnitude estimate of the annual operating cost of the Integrated Fare Vision. Given a pretty wide margin of error, we expect that the Integrated Fare Vision would cost the region anywhere from $5 - 200 million annually.
Additional Project Background
Seamless Bay Area’s Integrated Fare Vision, Map and Fare Calculator is intended to pique public interest in fare integration by helping riders understand how integrated fares could transform how they view and use public transit. The Map and Calculator are intended to complement the ongoing work of the Fare Integration and Coordination Study being overseen by MTC and the Clipper Executive Board in 2020-2021.
The Fare Integration Vision Map is foremost a communication tool intended to demonstrate the benefits of and build broad public support for integrated fares. As a “zone-based” fare system, it represents one example of an integrated fare system that would offer significant benefits to riders over the current system; however, it does not assume to be the best or only possible system for integrated fares.
The following principles developed by MTC to inform the current Fare Integration and Coordination Study have been reflected in the Integrated Fare Vision:
Treat the Bay Area transit network as one system
Fares should be predictable to users
No penalty for transferring
Discounts based on age and status should apply uniformly
Trips of a similar distance should cost a similar amount
Transit should be affordable for all
Passes, if offered, should encourage transit use, not operator loyalty
The Map was developed between January and September 2020 by Seamless Bay Area staff and volunteers. Ian Griffiths, Seamless Bay Area Policy Director, was the lead designer, with additional contributions from Sara Barz, Ian Ratzer, Adina Levin, Stephanie Beecham, and Brendan Nee. The calculator tool was a collaboration with Brendan Nee of BlinkTag Inc.